Balance Curve
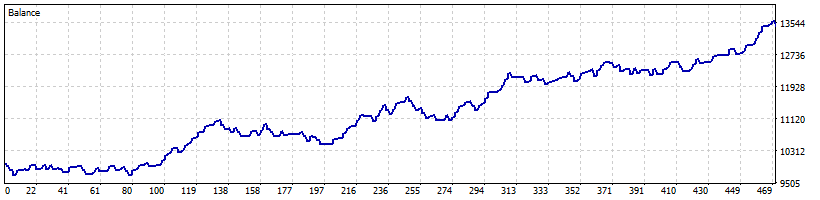
This balance curve is not meant to impress gamblers. It is meant to show a system that can participate, pause, recover, and continue without catastrophic behavior.

We do not claim to profit in every market phase. We care more about controlled drawdown, clean loss distribution, and staying usable when conditions are not ideal.
The current highlighted configuration is: v1.1.6-ic-candidate
This page shows a recent broker-aligned Standard Trend report on XAUUSD, using realistic tester conditions and a capital-preservation lens based on IC Markets MT5 data.
Core backtests shown here are run without the optional macro filter, so the underlying technical engine can be judged on its own merit. The macro overlay is evaluated separately in street tests, forward conditions, and future live validation.
This balance curve is not meant to impress gamblers. It is meant to show a system that can participate, pause, recover, and continue without catastrophic behavior.
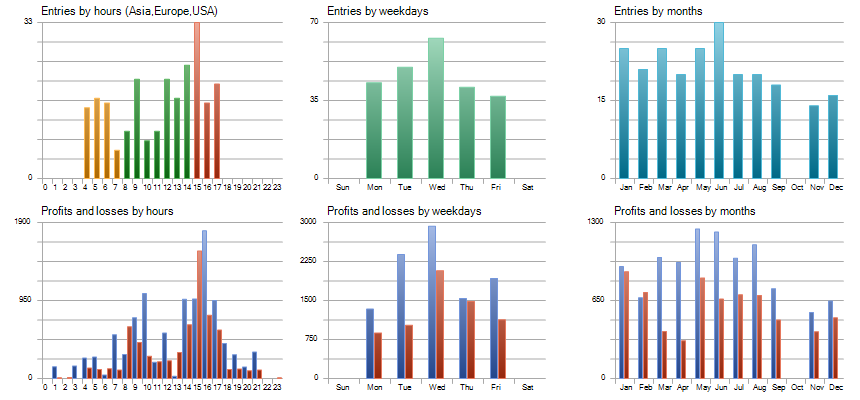
We pay close attention to trade distribution, not just headline profit. A healthier system should show controlled losses, realistic trade frequency, and no obvious martingale-style distortion.
The full-period report is the main reference point. These supporting snapshots help show that the result is not driven by a single lucky segment.
This section is not the primary baseline. It is a robustness check using simulated adverse execution conditions on the same IC Markets MT5 test basis.
2026 YTD remained especially resilient under the same simulated stress conditions, which adds confidence that the current Standard Trend candidate is not dependent on ideal fills alone.
This section tests whether the strategy still holds together when the trade sequence is randomized and a portion of trades is missed. It is meant to answer a practical question: does the system still look stable if reality does not arrive in the same neat order as the backtest curve?
2025 Only remained profitable in the Monte Carlo runs, with 0% probability of ending negative and about 5.54% probability of drawdown exceeding 10% under the 10% missed-trades scenario.2026 YTD remained especially resilient, with 0% probability of ending negative and 0% probability of drawdown exceeding 10% under the same 10% missed-trades scenario.If you only want the highest possible return screenshot, this page may feel too conservative.
If you care about the shape of losses, survival across difficult periods, and realistic deployment, this is the right kind of conversation.